
Ultrafine Particles Modelling
TNO is working on modelling particle numbers in ambient air, to gain more insight into people’s exposure and to better map the relationship between emissions and exposure.
This creates options for action. Most particles are smaller than 100 nm in diameter and are therefore referred to as ultrafine particles, with quantities expressed as particles per cm3.
We are now releasing a map of particle number concentrations for a large part of the Netherlands, at a resolution of 1x1 km2. This map is based on model results from the LOTOS-EUROS model, which calculates concentrations from hour to hour. The model describes atmospheric chemistry and particle processes, and incorporates meteorological factors from weather models and emissions based on (inter)national inventories. Because this is computationally intensive, we initially carried this out at this high resolution for part of the Netherlands.
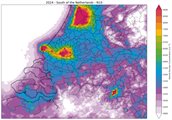
The map shows N10: the concentration of particles of 10 nm and larger, in line with regulated measurement standards. Airports, the ports of Rotterdam, and motorways stand out on the map. Aviation, shipping, and road traffic are the largest sources of particulate matter in the Netherlands, according to emission inventories. A comparison with available measurements shows that average concentrations are well represented at most locations, although they may be overestimated in grid cells covering the airports.
The map was created using emissions for the years 2018 and 2019 from projects for the EU (RI-Urbans) and DCMR, with simulations for the meteorological year 2024. One limitation of the map is that, for areas outside The Netherlands, emissions are only available at a resolution of approximately 6x6 km2, so less detail is visible in Belgium and the North Sea, and shipping routes and roads do not continue. Boundary conditions for the Dutch domain are derived from lower-resolution simulations covering a larger area.
We are working towards a nationwide map, incorporating the latest particle number emissions, including those from the Dutch Emission Register, together with RIVM and other partners.
The dataset that was used to generate the map can be downloaded as a zipped NetCDF file in the Downloads section here.